South Dakota Crime Rates & City Safety Scores
Population-adjusted FBI reporting rates; see the city profiles below.
Key facts
- 01
South Dakota displays a 50.18-point adjusted-score range in its 2025 source-year cohort: Aberdeen, South Dakota at 62.85 points out of 100 versus Rapid City, South Dakota at 12.67.
- 02
South Dakota displays 3 jurisdiction profiles from a scoring run containing 53 reportable jurisdictions in its 2025 source-year directory; 3 displayed profiles have scores.
- 03
South Dakota has 1 displayed jurisdictions with decreasing reported trajectories versus 2 increasing and 0 stable, comparing weighted 2024 reporting with 2025.
- 04
Sioux Falls, South Dakota has a reporting population of 197,642 residents versus 28,297 in Aberdeen, South Dakota, in the 2025 source-year displayed cohort.
Quick answer
In the Safety Atlas 2026 public safety index, the highest-scoring city in South Dakota is Aberdeen with an adjusted safety score of 62.85 out of 100, ranked across 3 tracked jurisdictions using 2025 FBI reporting.
Jump to section
South Dakota city safety rankings
Ranked by adjusted Safety Atlas score. The table lists the 3 most populous jurisdictions in this directory; each rank is calculated within this displayed 3-jurisdiction cohort.
| City / Jurisdiction | Cohort Rank | Population | Safety Score | Overall Trend | Actions |
|---|---|---|---|---|---|
| Aberdeen | #1 of 3 | 28,297 | 62.85 | ↑ Increasing | View Report → |
| Sioux Falls | #2 of 3 | 197,642 | 44.84 | ↓ Decreasing | View Report → |
| Rapid City | #3 of 3 | 76,836 | 12.67 | ↑ Increasing | View Report → |
* Trajectory trends compare weighted year-over-year reporting from 2024 to 2025. Scores describe relative reported rates, not personal risk. Cohort rank covers only the 3 jurisdictions listed above.
Data, definitions and reuse
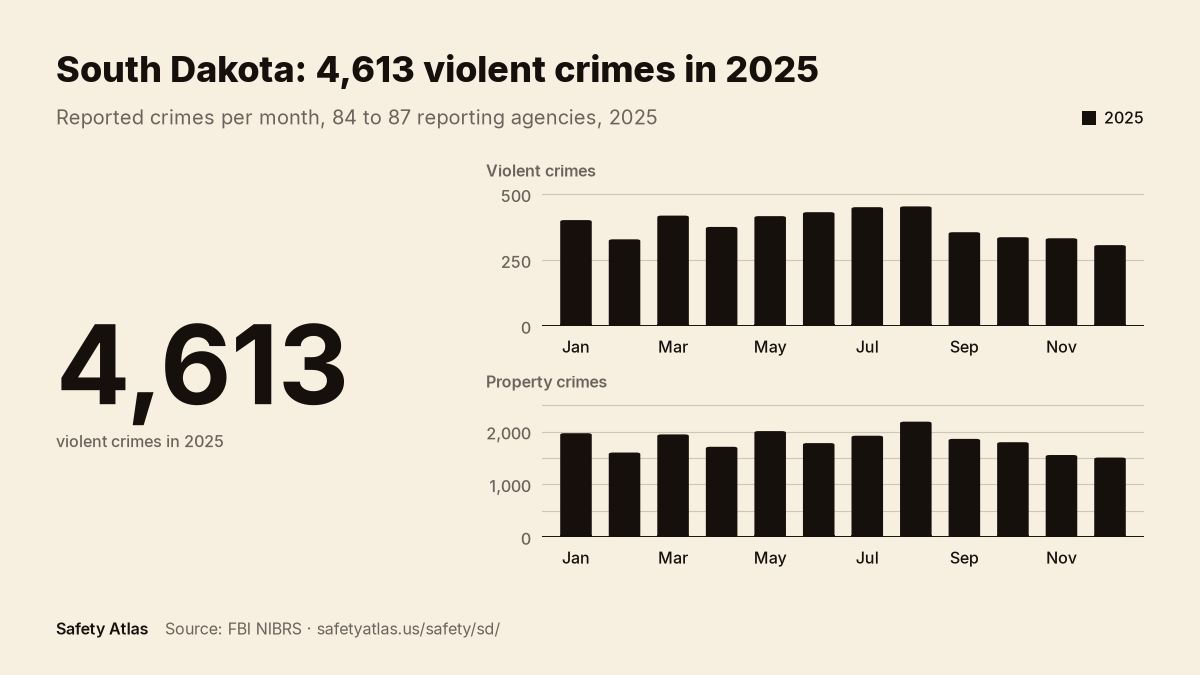
Violent: murder, rape, robbery, aggravated assault. Property: burglary, larceny, vehicle theft, arson. Monthly counts are summed over the agencies that reported each month, and agency coverage changes over time.
| Month | Violent | Property | Agencies reporting |
|---|---|---|---|
| Jan | 402 | 1970 | 86 |
| Feb | 329 | 1603 | 86 |
| Mar | 419 | 1947 | 86 |
| Apr | 376 | 1712 | 87 |
| May | 417 | 2010 | 87 |
| Jun | 432 | 1782 | 85 |
| Jul | 451 | 1922 | 85 |
| Aug | 454 | 2189 | 86 |
| Sep | 356 | 1862 | 85 |
| Oct | 337 | 1799 | 85 |
| Nov | 333 | 1556 | 84 |
| Dec | 307 | 1508 | 85 |
Reuse under CC BY 4.0; indicate changes. Embed code:
<img src="https://www.safetyatlas.us/img/charts/south-dakota-crime-trend-2025.webp" alt="Chart of South Dakota crime statistics: South Dakota agencies reported 4,613 violent offenses in 2025. Between 84 to 87 agencies reported each month, so the total is not compared with 2024. Shows violent and property offenses per month." width="1200" height="675" loading="lazy" style="max-width:100%;height:auto">
<p>Source: <a href="https://www.safetyatlas.us/safety/sd/">Safety Atlas, South Dakota</a>. <a href="https://creativecommons.org/licenses/by/4.0/">CC BY 4.0</a>.</p>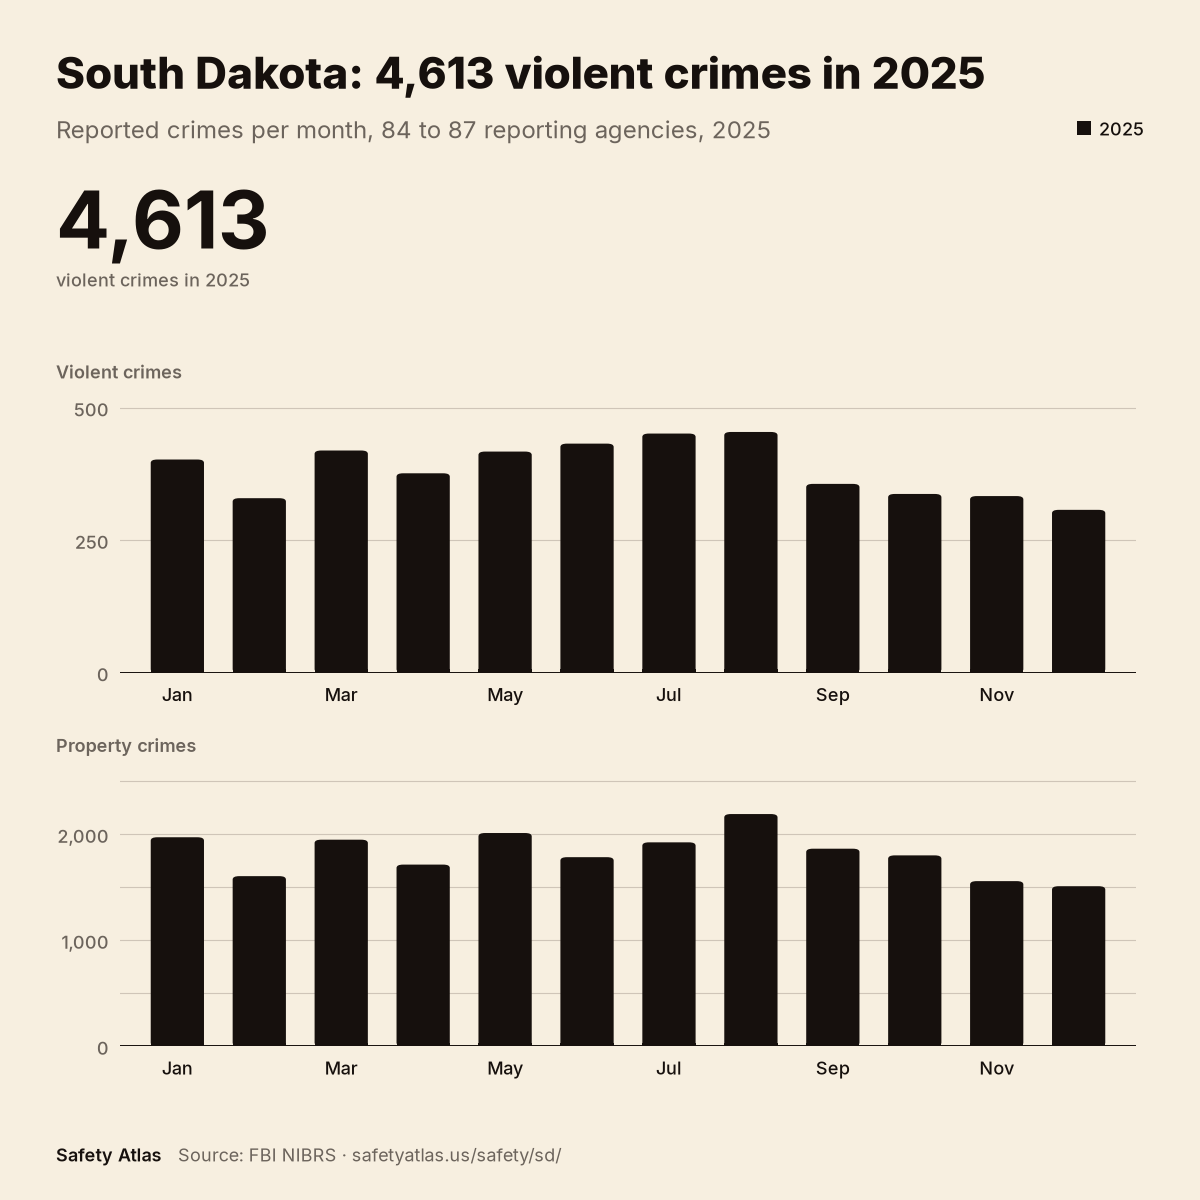
South Dakota in 7 numbers
- Every major offense fell in 2025. Motor vehicle theft -30% (3,126 to 2,186), homicide -29%, robbery -24%, burglary -20%, larceny-theft -13%, aggravated assault -9%.
- Almost half of all reports are property crime. 25,199 of 65,029 reports (38.8%); larceny-theft alone is 17,090 (26.3%).
- Clearances skew toward violent crime. 74% of homicides cleared vs 16% of burglaries and 19% of larcenies (2025, reports cleared divided by reports received, reporting agencies only).
- Homicides fell by nearly a fifth. 50 reports in 2025 vs 70 in 2024 (-29%) across reporting agencies.
- The biggest volume is not violent. Simple assault (13,050) alone outweighs the entire personal-safety total (4,815, 7.4% of reports).
- Watch the monthly shape. Larceny-theft peaked in Aug (1,723) and troughed in Nov (1,164), a 1.5× swing inside a single year.
- These are reporting-agency sums. 26 of 130 agencies reported motor vehicle theft in December 2025 (vs 26 in January); totals reflect who reported, not a census of crime.
Takeaways are computed from summed FBI CDE reported counts (source year 2025, 130 agencies in file). They describe reported data, not forecasts; check the methodology and coverage notes before reuse.
Every number on this page ships in the South Dakota workbook.
South Dakota monthly trend: reporting-agency sums through December 2025
Annual totals hide timing. The bars below show 2025 reported counts per month summed across reporting agencies for three indicator offenses. Counts only; there is no honest monthly denominator at this grain, so no rates are shown.
Larceny-theft, month by month
↓ Decreasing, 17090 reports vs 19657 in 2024 (down 13% in reported data).
| Month | Count | Agencies | Coverage |
|---|---|---|---|
| Jan 2025 | 1,487 | 26 | Full |
| Feb 2025 | 1,258 | 26 | Full |
| Mar 2025 | 1,517 | 26 | Full |
| Apr 2025 | 1,352 | 26 | Full |
| May 2025 | 1,455 | 26 | Full |
| Jun 2025 | 1,408 | 26 | Full |
| Jul 2025 | 1,512 | 26 | Full |
| Aug 2025 | 1,723 | 26 | Full |
| Sep 2025 | 1,510 | 26 | Full |
| Oct 2025 | 1,462 | 26 | Full |
| Nov 2025 | 1,164 | 26 | Full |
| Dec 2025 | 1,242 | 26 | Full |
Simple assault, month by month
→ Stable, 13050 reports vs 13331 in 2024 (about level in reported data).
| Month | Count | Agencies | Coverage |
|---|---|---|---|
| Jan 2025 | 1,094 | 26 | Full |
| Feb 2025 | 941 | 26 | Full |
| Mar 2025 | 1,129 | 26 | Full |
| Apr 2025 | 1,115 | 26 | Full |
| May 2025 | 1,116 | 26 | Full |
| Jun 2025 | 1,121 | 26 | Full |
| Jul 2025 | 1,205 | 26 | Full |
| Aug 2025 | 1,179 | 26 | Full |
| Sep 2025 | 1,159 | 26 | Full |
| Oct 2025 | 1,101 | 26 | Full |
| Nov 2025 | 953 | 26 | Full |
| Dec 2025 | 937 | 26 | Full |
Drug/Narcotic Violations, month by month
→ Stable, 9830 reports vs 10856 in 2024 (about level in reported data).
| Month | Count | Agencies | Coverage |
|---|---|---|---|
| Jan 2025 | 865 | 26 | Full |
| Feb 2025 | 789 | 26 | Full |
| Mar 2025 | 953 | 26 | Full |
| Apr 2025 | 946 | 26 | Full |
| May 2025 | 791 | 26 | Full |
| Jun 2025 | 660 | 26 | Full |
| Jul 2025 | 713 | 26 | Full |
| Aug 2025 | 871 | 26 | Full |
| Sep 2025 | 882 | 26 | Full |
| Oct 2025 | 844 | 26 | Full |
| Nov 2025 | 757 | 26 | Full |
| Dec 2025 | 759 | 26 | Full |
Clearances: what got cleared in 2025
74% of homicides cleared vs 16% of burglaries, clearance follows violent crime, not volume.
| Offense | Reported | Cleared | Clearance rate |
|---|---|---|---|
| Homicide | 50 | 37 | 74.0% |
| Aggravated Assault | 3,585 | 2,079 | 58.0% |
| Robbery | 304 | 93 | 30.6% |
| Burglary | 2,484 | 398 | 16.0% |
| Larceny-theft | 17,090 | 3,291 | 19.3% |
| Motor Vehicle Theft | 2,186 | 425 | 19.4% |
Clearances ÷ reports received; clearances may concern earlier reports, so this is not a solve rate.
Monthly counts summed over reporting agencies, FBI CDE source year 2025. A hyphen (-) means not reported, not zero. Totals reflect who reported, not a census of crime.
Downloads: South Dakota monthly series (JSON) · same data (CSV) · build manifest
South Dakota city reports
- Aberdeen safety report: #1 of 3, population 28,297, score 62.85, and the displayed trajectory is ↑ Increasing.
- Sioux Falls safety report: #2 of 3, population 197,642, score 44.84, and the displayed trajectory is ↓ Decreasing.
- Rapid City safety report: #3 of 3, population 76,836, score 12.67, and the displayed trajectory is ↑ Increasing.
Reading the comparison
Scores compare reported rates; they do not predict personal risk. Methodology · Coverage
Monthly count comparisons
South Dakota reporting agencies recorded 1,723 larceny-theft offenses in Aug 2025 versus 1,164 in Nov 2025, a difference of 559 reports; 26 agencies reported in the peak-count month compared with 26 in the minimum-count month, within 12 displayed months totaling 17,090 reports (FBI CDE reporting-agency sums, not statewide population rates).
South Dakota reporting agencies recorded 1,205 simple assault offenses in Jul 2025 versus 937 in Dec 2025, a difference of 268 reports; 26 agencies reported in the peak-count month compared with 26 in the minimum-count month, within 12 displayed months totaling 13,050 reports (FBI CDE reporting-agency sums, not statewide population rates).
South Dakota reporting agencies recorded 953 drug/narcotic violations offenses in Mar 2025 versus 660 in Jun 2025, a difference of 293 reports; 26 agencies reported in the peak-count month compared with 26 in the minimum-count month, within 12 displayed months totaling 9,830 reports (FBI CDE reporting-agency sums, not statewide population rates).
South Dakota reporting agencies recorded 37 cleared homicide offenses against 50 reports received in 2025 (74.0%), compared with 398 cleared burglary offenses against 2,484 reports (16.0%), a 58.0-percentage-point difference between the displayed clearance ratios; clearances can concern earlier reports.
Rapid City, South Dakota records 12.67 adjusted score points out of 100 in the 2025 source-year directory, 27.45 points below the displayed scored-cohort mean of 40.12; its reporting population of 76,836 residents accounts for 25.4% of the 302,775 residents summed across the 3 displayed jurisdiction populations.
Aberdeen, South Dakota records 62.85 adjusted score points out of 100 in the 2025 source-year directory, 22.73 points above the displayed scored-cohort mean of 40.12; its reporting population of 28,297 residents accounts for 9.3% of the 302,775 residents summed across the 3 displayed jurisdiction populations.
Sioux Falls, South Dakota records 44.84 adjusted score points out of 100 in the 2025 source-year directory, 4.72 points above the displayed scored-cohort mean of 40.12; its reporting population of 197,642 residents accounts for 65.3% of the 302,775 residents summed across the 3 displayed jurisdiction populations.
South Dakota reporting-agency sums contain 17,090 larceny-theft reports in 2025 versus 19,657 in 2024, 2,567 reports (13.1%) fewer across the two complete twelve-month source series; monthly reporting participation ranges from 26 to 28 agencies across those years, so the count change includes differences in participation and is not a population-adjusted rate change.
South Dakota reporting-agency sums contain 13,050 simple assault reports in 2025 versus 13,331 in 2024, 281 reports (2.1%) fewer across the two complete twelve-month source series; monthly reporting participation ranges from 26 to 28 agencies across those years, so the count change includes differences in participation and is not a population-adjusted rate change.
South Dakota reporting-agency sums contain 6,411 vandalism reports in 2025 versus 8,066 in 2024, 1,655 reports (20.5%) fewer across the two complete twelve-month source series; monthly reporting participation ranges from 26 to 28 agencies across those years, so the count change includes differences in participation and is not a population-adjusted rate change.
How to read the South Dakota directory
The scoring run contains 53 reportable jurisdictions in South Dakota. This public directory displays the 3 most populous jurisdictions in the current scored comparison set, and each displayed city's rank is calculated within this displayed 3-jurisdiction cohort.
Within the displayed cohort, Aberdeen has the highest adjusted score at 62.85, and Rapid City has the lowest at 12.67. The public-cohort range is 50.18 points; use the offense-rate tables on each city profile to understand that spread.
Current trajectories in the displayed cohort: 1 decreasing, 0 stable, and 2 increasing. Trends compare weighted 2024 and 2025 reporting and do not forecast future incidents.
Review the scoring method, coverage report, and buyer checklist before citing or purchasing data.
Explore Safety Resources
What Is the Safest State?
Compare population-adjusted crime scores across all 50 states.
Our Methodology
Learn how we calculate safety indexes using log-relief normalization.
Safety Atlas Datasets
Get API access or download offline data workbooks for all states.