Is Houston, TX Safe? 2026 Crime Rates & Safety Report
Key facts
- 01
Houston, Texas reported 211.74 robbery offenses per 100,000 residents in 2025, 4.39 times the national reference of 48.24 per 100,000 and 163.50 per 100,000 above that reference, with 4,871 annual reported offenses (FBI CDE 2025 profile).
- 02
Houston, Texas reported 550.90 motor vehicle theft offenses per 100,000 residents in 2025, 2.85 times the national reference of 193.00 per 100,000 and 357.90 per 100,000 above that reference, with 12,673 annual reported offenses (FBI CDE 2025 profile).
- 03
Houston, Texas reported 648.66 aggravated assault offenses per 100,000 residents in 2025, 2.83 times the national reference of 229.56 per 100,000 and 419.10 per 100,000 above that reference, with 14,922 annual reported offenses (FBI CDE 2025 profile).
- 04
Houston, Texas reported 512.43 burglary offenses per 100,000 residents in 2025, 2.72 times the national reference of 188.15 per 100,000 and 324.28 per 100,000 above that reference, with 11,788 annual reported offenses (FBI CDE 2025 profile).
- 05
Houston, Texas reported 2,960.37 larceny-theft offenses per 100,000 residents in 2025, 2.67 times the national reference of 1,106.97 per 100,000 and 1,853.40 per 100,000 above that reference, with 68,101 annual reported offenses (FBI CDE 2025 profile).
Quick answer
In the Safety Atlas 2026 public safety index, Houston, TX has an adjusted safety score of 17.68 out of 100. It ranks #6 in this comparison set out of the 6 jurisdictions in the current scored comparison set in Texas. Its overall crime trajectory is currently classified as decreasing.
Jump to Section
Data, definitions and reuse
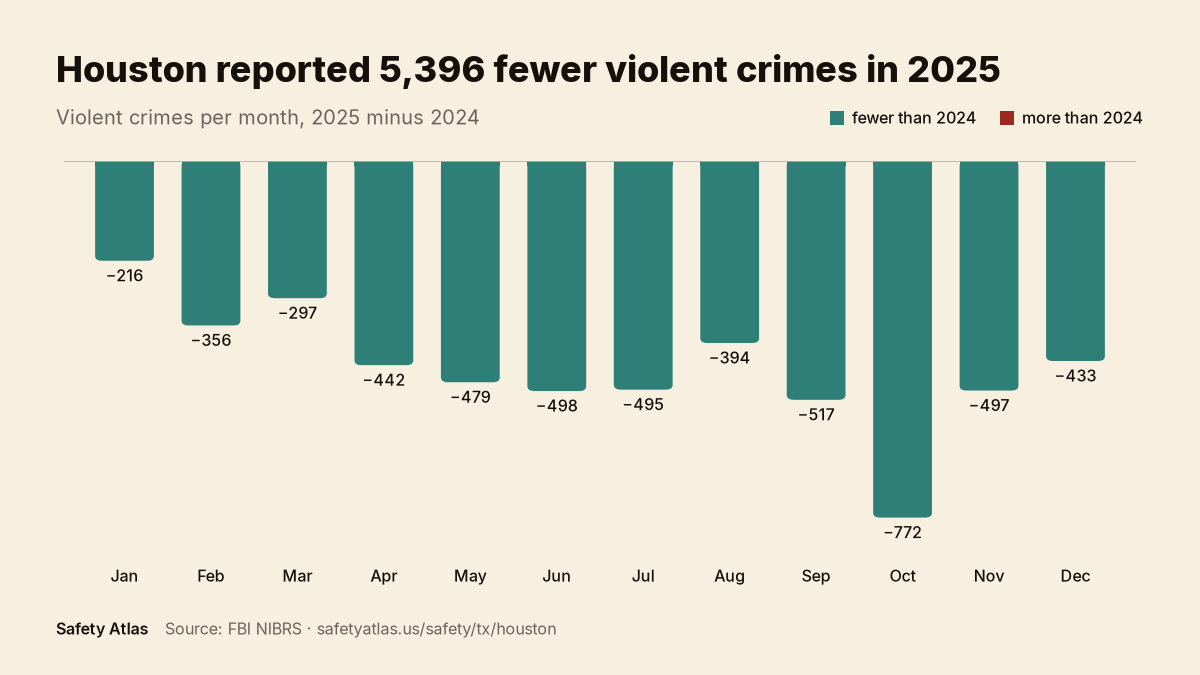
Violent: murder, rape, robbery, aggravated assault. Property: burglary, larceny, vehicle theft, arson. Subcategories are excluded to avoid double counting. Counts are offenses reported to police in this jurisdiction, not rates, neighborhood scores or a census of all crime.
| Month | Violent | Property |
|---|---|---|
| Jan | 1750 | 7765 |
| Feb | 1577 | 6760 |
| Mar | 1975 | 7893 |
| Apr | 1974 | 8120 |
| May | 2073 | 8598 |
| Jun | 1880 | 8047 |
| Jul | 1783 | 7809 |
| Aug | 1880 | 7773 |
| Sep | 1683 | 7288 |
| Oct | 1667 | 7484 |
| Nov | 1583 | 7181 |
| Dec | 1578 | 7703 |
Reuse under CC BY 4.0; indicate changes. The downloaded image carries our name, licence and source in its metadata. Embed code:
<img src="https://www.safetyatlas.us/img/charts/houston-tx-crime-trend-2025.webp" alt="Chart of Houston, TX crime statistics: Houston reported 21,403 violent offenses in 2025, 20.1% fewer than in 2024. Shows monthly violent offense differences versus 2024." width="1200" height="675" loading="lazy" style="max-width:100%;height:auto">
<p>Source: <a href="https://www.safetyatlas.us/safety/tx/houston">Safety Atlas, Houston, TX</a>. <a href="https://creativecommons.org/licenses/by/4.0/">CC BY 4.0</a>.</p>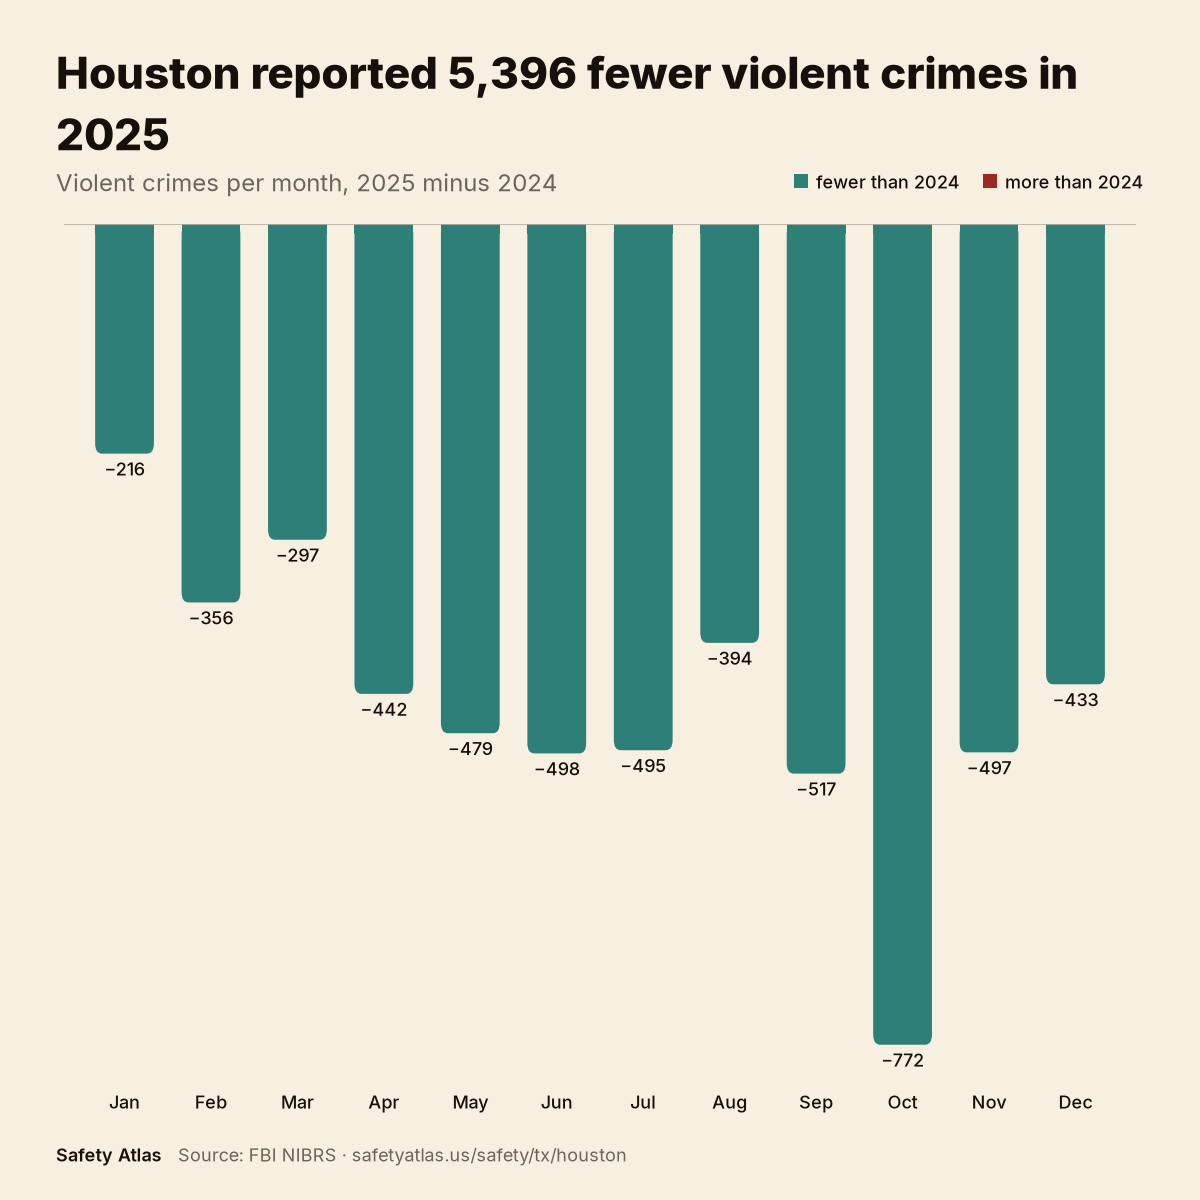
2026 edition, FBI source year 2025.
Houston in 7 numbers
- Robbery fell by a quarter. 4,859 reports in 2025 vs 6,360 in 2024 (−24%), the largest year-over-year move of any indicator offense.
- Almost half of all reports are property crime. 117,311 of 218,578 reports (53.7%); larceny-theft alone is 67,888 (31.1%).
- Clearances skew toward violent crime. 77.7% of homicides cleared vs 4.5% of larcenies and 6.3% of motor vehicle thefts (2025, reports cleared ÷ reports received).
- A second look at robbery. January (480) ran 1.4× October (349); the year finished down 24%.
- Aggravated Assault is volatile but down. Monthly counts swung 1.4× (May 1488 vs Feb 1066); the year finished 19% below 2024.
- The biggest volume isn’t violent. Simple assault (26,476) and theft from motor vehicle (23,829) dwarf the whole personal-safety total (21,817, 10.0% of reports).
- Small months, big bars. December’s 1122 aggravated assaults vs May’s 1488 is a gap of 366 reports, monthly charts amplify small-number swings. Read the 12-month direction, not one bar.
Takeaways are computed from FBI CDE reported counts (source year 2025, TXHPD0000). They describe reported data, not forecasts; check the methodology and coverage notes before reuse.
Every number on this page ships in the Texas workbook.
Key Public Safety Indicators
Reported rates per 100,000 residents; national references shown alongside.
| Offense Class | Annual Count | Rate per 100K | National Avg | vs National |
|---|---|---|---|---|
| Robbery | 4871 | 211.74 | 48.24 |
4.39× national |
| Aggravated Assault | 14922 | 648.66 | 229.56 |
2.83× national |
| Burglary | 11788 | 512.43 | 188.15 |
2.72× national |
| Larceny-theft | 68101 | 2960.37 | 1106.97 |
2.67× national |
| Motor Vehicle Theft | 12673 | 550.9 | 193.0 |
2.85× national |
Houston monthly trend: reported counts through December 2025
Annual totals hide timing. The bars below show 2025 reported counts per month for the three highest-relative indicator offenses; each table carries the same numbers with FBI pre-computed rates. The full 19-offense monthly series (2020-2025) is downloadable below.
Robbery, month by month
↓ Decreasing, 4859 reports vs 6360 in 2024 (down 24% in reported data).
| Month | Count | Rate per 100K | Coverage |
|---|---|---|---|
| Jan 2025 | 480 | 19.89 | Full |
| Feb 2025 | 395 | 16.37 | Full |
| Mar 2025 | 455 | 18.85 | Full |
| Apr 2025 | 450 | 18.64 | Full |
| May 2025 | 432 | 17.9 | Full |
| Jun 2025 | 400 | 16.57 | Full |
| Jul 2025 | 402 | 16.66 | Full |
| Aug 2025 | 403 | 16.7 | Full |
| Sep 2025 | 371 | 15.37 | Full |
| Oct 2025 | 349 | 14.46 | Full |
| Nov 2025 | 362 | 15 | Full |
| Dec 2025 | 360 | 14.92 | Full |
Motor Vehicle Theft, month by month
↓ Decreasing, 12598 reports vs 16403 in 2024 (down 23% in reported data).
| Month | Count | Rate per 100K | Coverage |
|---|---|---|---|
| Jan 2025 | 1104 | 45.74 | Full |
| Feb 2025 | 1002 | 41.52 | Full |
| Mar 2025 | 1160 | 48.06 | Full |
| Apr 2025 | 1120 | 46.4 | Full |
| May 2025 | 1087 | 45.04 | Full |
| Jun 2025 | 1205 | 49.93 | Full |
| Jul 2025 | 1087 | 45.04 | Full |
| Aug 2025 | 1031 | 42.72 | Full |
| Sep 2025 | 970 | 40.19 | Full |
| Oct 2025 | 978 | 40.52 | Full |
| Nov 2025 | 905 | 37.5 | Full |
| Dec 2025 | 949 | 39.32 | Full |
Aggravated Assault, month by month
↓ Decreasing, 14866 reports vs 18349 in 2024 (down 19% in reported data).
| Month | Count | Rate per 100K | Coverage |
|---|---|---|---|
| Jan 2025 | 1123 | 46.53 | Full |
| Feb 2025 | 1066 | 44.17 | Full |
| Mar 2025 | 1337 | 55.4 | Full |
| Apr 2025 | 1349 | 55.89 | Full |
| May 2025 | 1488 | 61.65 | Full |
| Jun 2025 | 1345 | 55.73 | Full |
| Jul 2025 | 1253 | 51.92 | Full |
| Aug 2025 | 1331 | 55.15 | Full |
| Sep 2025 | 1168 | 48.39 | Full |
| Oct 2025 | 1175 | 48.68 | Full |
| Nov 2025 | 1109 | 45.95 | Full |
| Dec 2025 | 1122 | 46.49 | Full |
Clearances: what got cleared in 2025
78% of homicides cleared vs 4% of larcenies, clearance follows violent crime, not volume.
| Offense | Reported | Cleared | Clearance rate |
|---|---|---|---|
| Homicide | 273 | 212 | 77.7% |
| Aggravated Assault | 14,866 | 4,584 | 30.8% |
| Robbery | 4,859 | 862 | 17.7% |
| Burglary | 11,749 | 706 | 6.0% |
| Larceny-theft | 67,888 | 3,050 | 4.5% |
| Motor Vehicle Theft | 12,598 | 797 | 6.3% |
Clearances ÷ reports received; clearances may concern earlier reports, so this is not a solve rate.
Monthly counts and FBI pre-computed rates per 100,000, FBI CDE source year 2025, TXHPD0000. Rates use FBI month-specific covered-population denominators and are shown as published, not recomputed. A hyphen (-) means not reported, not zero. Annual totals equal the sum of shown months within ±2% (see manifest).
Downloads: Houston monthly series (JSON) · same data (CSV) · build manifest
Comparing Houston to somewhere else? Take the file with you.
What drives Houston's safety score?
Houston ranks in the bottom quarter of the 6 jurisdictions in the current scored comparison set in Texas, ahead of approximately 0% of that scored set. The profile uses a reporting population of 2,300,419 and source-year data through 2025; it is a citywide agency-level comparison, not a neighborhood forecast.
The strongest of the three score components is Community Order at 29.04, while Personal Safety is lowest at 10.84. The 18.2-point spread shows why the composite should be read by component instead of as a single absolute claim about safety.
Among the five public offense indicators, Robbery is highest relative to its national reference at 211.74 per 100,000 (4.39× the national rate). Larceny-theft is lowest on the same relative basis at 2960.37 per 100,000 (2.67× national).
Coverage check: 18 of 18 tracked offense classes have reportable values in this profile. Missing values are not converted to zero.
Public indicator mix
Houston, Texas recorded 68,101 larceny-theft offenses in 2025, 60.6% of the 112,355 reports across its five public indicators, compared with 4,871 robbery reports (4.3%); this share covers only those five indicators, excluding other offense classes.
Houston, Texas recorded 14,922 aggravated assault offenses in 2025, 13.3% of the 112,355 reports across its five public indicators, compared with 4,871 robbery reports (4.3%); this share covers only those five indicators, excluding other offense classes.
Houston, Texas recorded 12,673 motor vehicle theft offenses in 2025, 11.3% of the 112,355 reports across its five public indicators, compared with 4,871 robbery reports (4.3%); this share covers only those five indicators, excluding other offense classes.
Houston, Texas uses a reporting population of 2,300,419 residents and has values for 18 of the 18 tracked offense classes (100.0%) in its 2025 profile; coverage describes available classes rather than the share of residents reporting crime.
Houston, Texas has an adjusted score of 17.68 points out of 100 versus 58.9 in El Paso, Texas, a difference of 41.22 points below that displayed state peer in the 2025 source-year profile; Houston ranks 6 of 6 scored jurisdictions in the published state comparison set.
Houston, Texas has an adjusted score of 17.68 points out of 100 versus 37.85 in Fort Worth, Texas, a difference of 20.17 points below that displayed state peer in the 2025 source-year profile; Houston ranks 6 of 6 scored jurisdictions in the published state comparison set.
Detailed Crime Class Breakdown
Additional tracked offense classes
- Homicide
- Rape
- Kidnapping/Abduction
- Human Trafficking
- Arson
- Theft From Building
- Theft From Motor Vehicle
- Simple Assault
- Intimidation
- Stolen Property Offenses
- Vandalism
- Weapon Law Violations
- Drug/Narcotic Violations
Frequently Asked Questions
Is Houston safe compared to other places in Texas?
Houston is classified as having low relative safety in the 2026 Safety Atlas Index. It has an adjusted safety score of 17.68 out of 100 and ranks #6 in this comparison set out of the 6 jurisdictions in the current scored comparison set in Texas.
What is the crime rate in Houston?
Public offense rates are listed above.
What is Houston's safety rating?
Houston's safety rating in the 2026 Safety Atlas Index is 17.68 out of 100, which ranks #6 in this comparison set out of the 6 jurisdictions in the current scored comparison set in Texas. Its overall crime trajectory is currently classified as decreasing, using source-year data through 2025.
What is the safest neighborhood in Houston?
This profile covers the reporting jurisdiction; consult local sources for neighborhood detail.
Why are some crime statistics locked for Houston?
Full offense series: state workbook.
How fresh is the monthly crime data on this page?
Monthly figures track FBI CDE source year 2025, the same vintage as the annual table above. A new FBI release typically lags several months; the caption stamps the source year and export date. Values can revise when the FBI re-publishes. Full monthly series for Houston are downloadable as JSON and CSV.
Why does the monthly chart move so much?
Monthly counts are small numbers, a difference of a few reports swings the bar. Reporting practice, staffing, and seasonal patterns all move single months. Read the 12-month direction in the trajectory line, not one bar. This profile measures the reporting jurisdiction only; it cannot rank neighborhoods within Houston.
What does the clearance rate on this page mean?
It divides 2025 reports cleared by 2025 reports received for that offense, including clearances of earlier reports, so it is a workload snapshot, not a guarantee a given case is solved. In Houston, violent offenses clear at far higher rates than property offenses (homicide 78%, larceny-theft 4.5%). Monthly clearance detail is not published yet.
Reading notes
Safety Atlas methodology · 2026 coverage report
Cite This Public Safety Profile
Citation formats:
Primary Source Data Integrity
- Crime Counts: FBI National Incident-Based Reporting System (NIBRS) database.
- Demographics: U.S. Census Bureau American Community Survey (ACS) 5-year estimate boundaries.
- Methodology: Adjusted per-capita normalization with small-sample relief controls. View our complete Methodology Documentation.